Notes on data, genomics and teaching
Subscribe via RSS
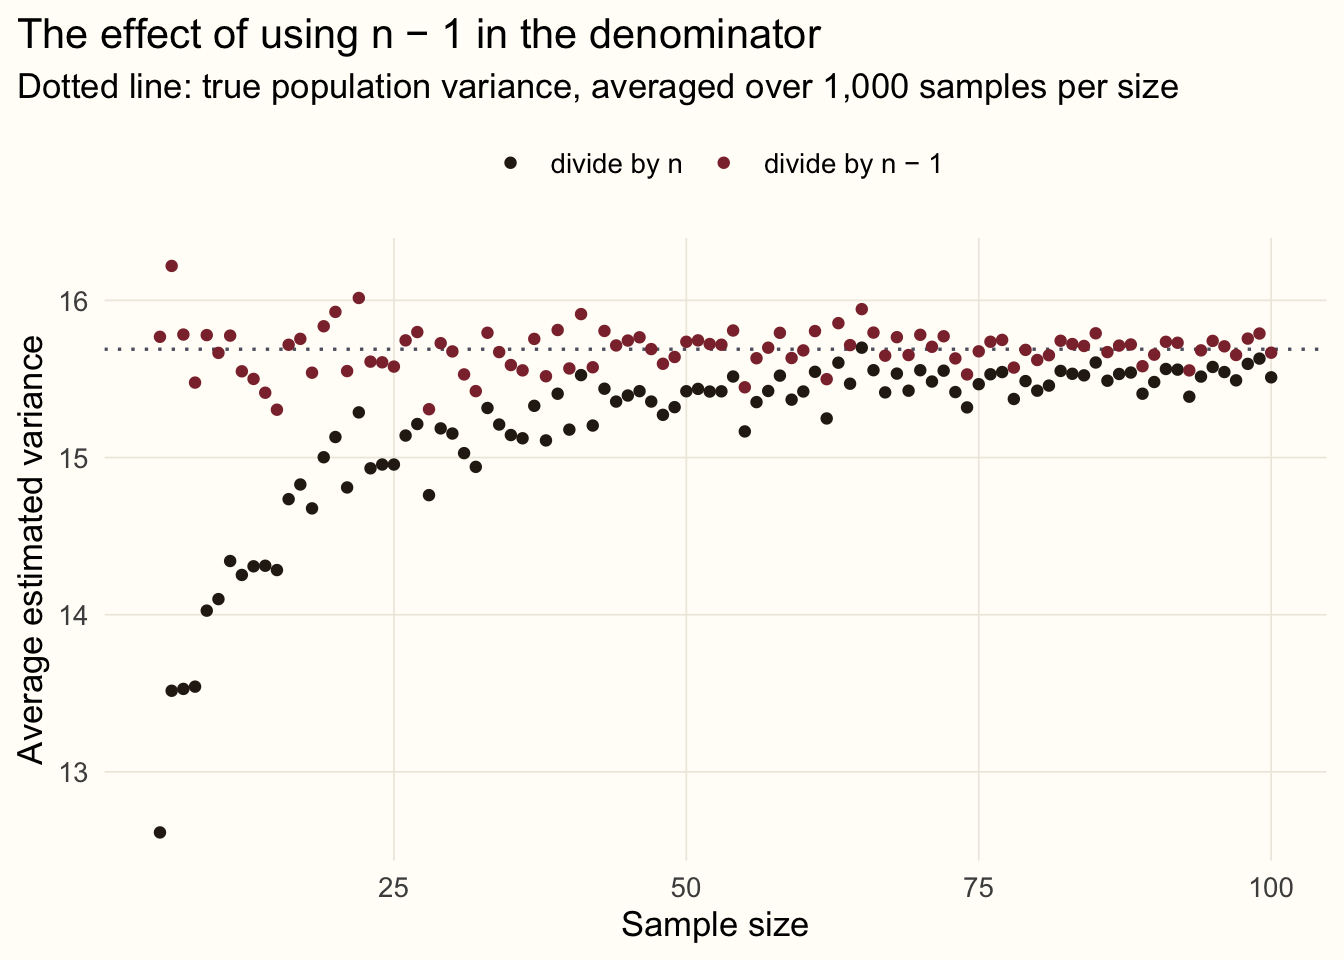
First in a series on statistical tests: what the mean, median, variance and standard deviation really measure, and why we divide by n − 1.
Agent-based simulation of epidemics in R using OOP and R6 classes.
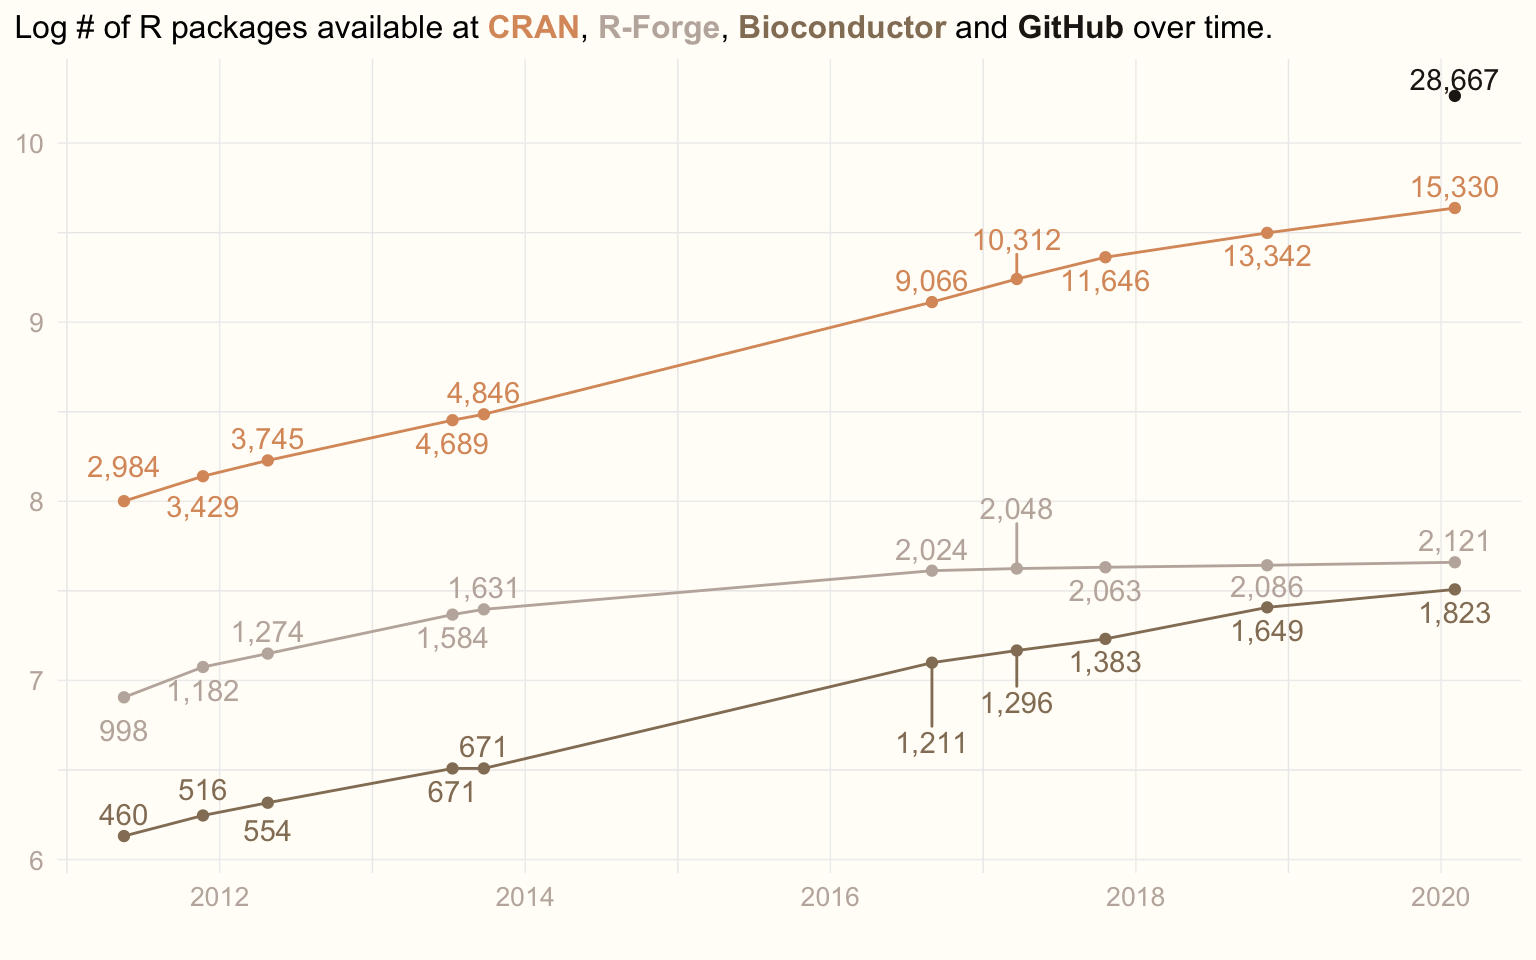
Redrawing my old ‘growth of R packages’ plot with ideas from William R. Chase’s ‘The Glamour of Graphics’.
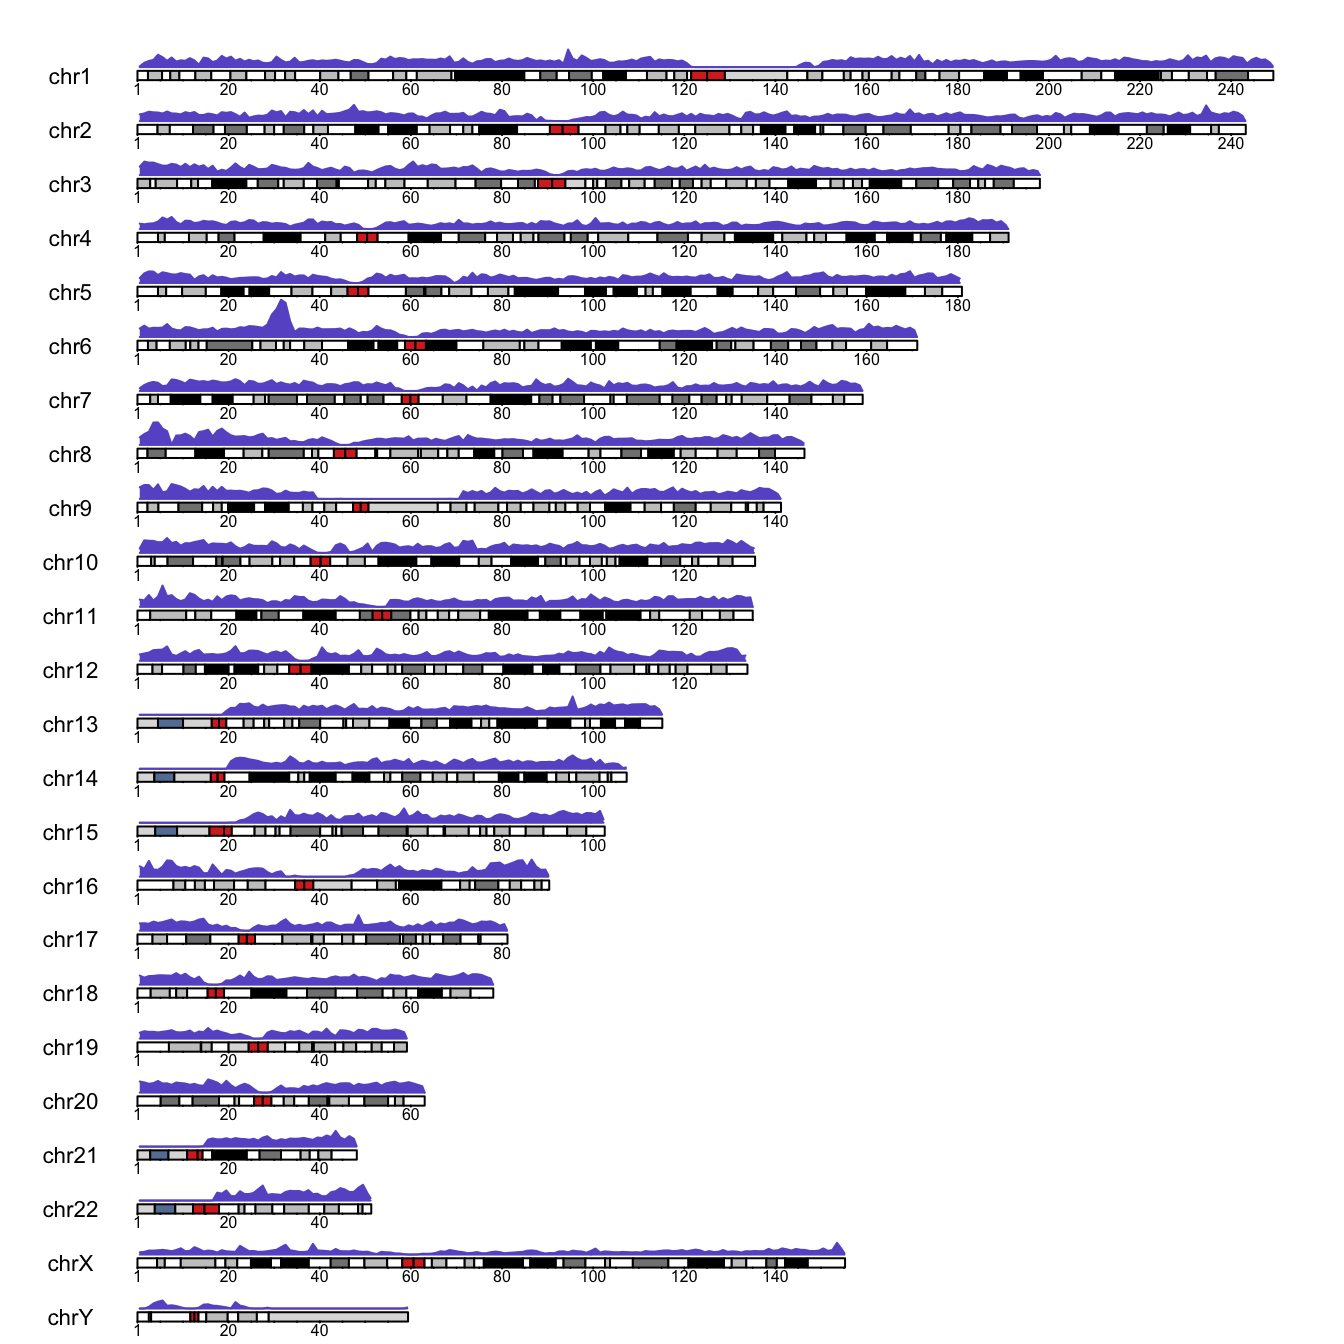
How to draw the density of genotyped SNPs along a karyogram, and then zoom in on a region of interest.